Home » Sustainability
LNG is considered a key transitional fuel as the world moves toward green renewable energy. LNG has a smaller footprint than other fossil fuels, minimizing environmental impact. The Patented LNG extraction technology eliminates flaring, premature capping, as well as eliminates the need for water use. Our “all in one factory” unit reduces clean-up costs by cleaning up abandoned oil wells.
We believe the best green technologies make an immediate impact and make life easier and greener for our customers.
LNG is viewed as a cleaner alternative to fuel oil and coal. We provide a range of green energy products and solutions for a more liveable, cost-effective, climate-positive future. Akashic technologies offer alternative fuel source that can be utilized as the world transitions to cleaner gases and renewable energy technologies that have far lower emissions profiles than natural gas.

Presently, LNG is the cleanest-burning fossil fuel. Increased use of LNG can significantly improve local air quality as well as reduce carbon dioxide (CO2) emissions.
LNG releases 40% less CO2 than coal
20% less CO2 than fuel oil
Dramatically reduces nitrogen oxide emissions
Does not emit soot, dust or fumes
Produces insignificant amounts of sulfur dioxide, mercury, and other particulates compared to other fuels.

Estimates of lost boil-off gas volumes are from 1% to 5% of overall facility throughput.
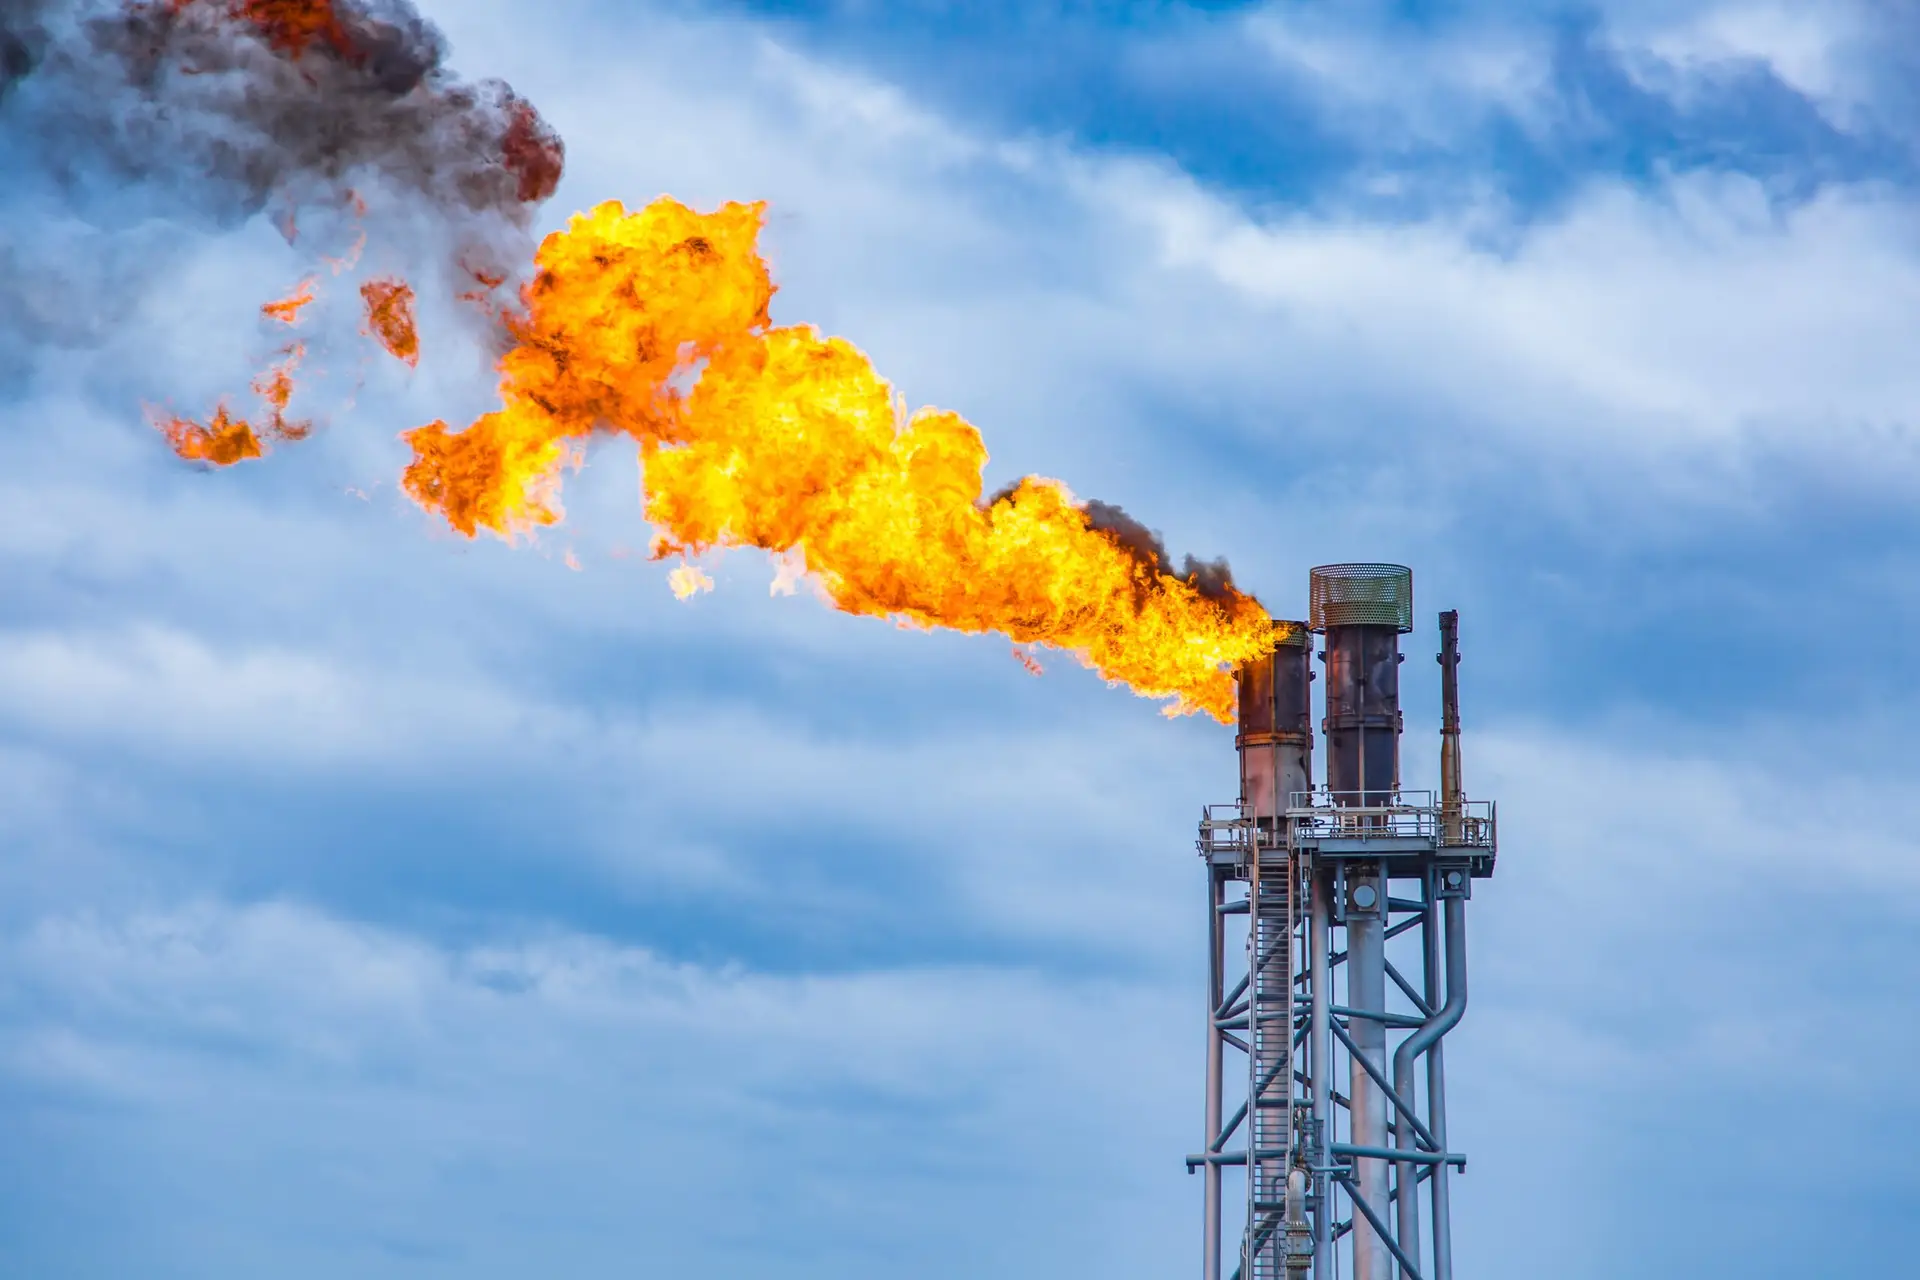
Each HRU can recover approximately 5 million Cubic Feet (MMCFT) of boil-off/flare gas and re-liquefy it back into LNG and ready for transport.
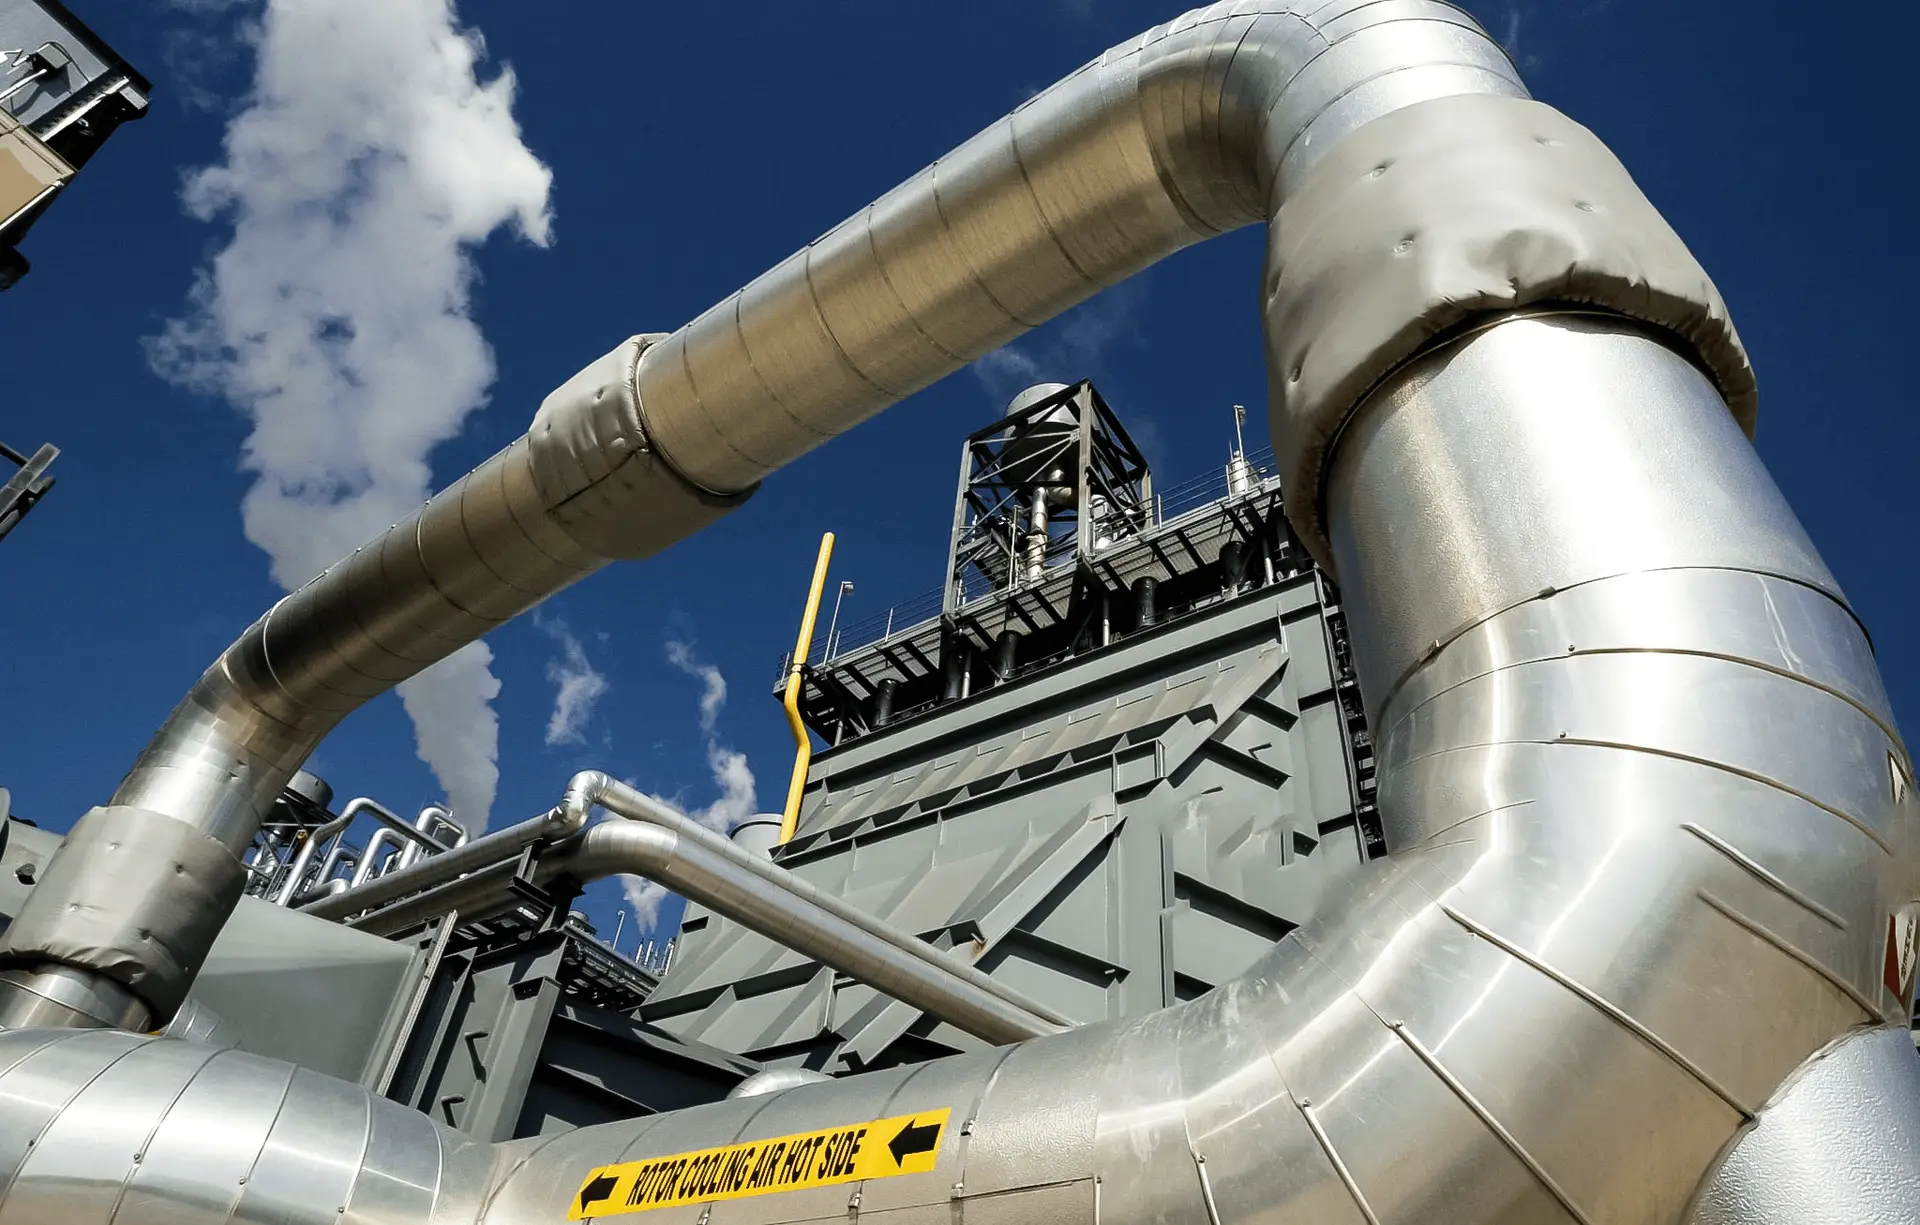
Preliminary estimates suggest we can deploy between up to 80 HRU systems, liquefying a total of 2.3 to 2.7 million tons of LNG per annum.

Conservative calculations suggest a total capacity of 9.3 million tonnes of flare gas capacity (116,370 tonnes per unit annually)
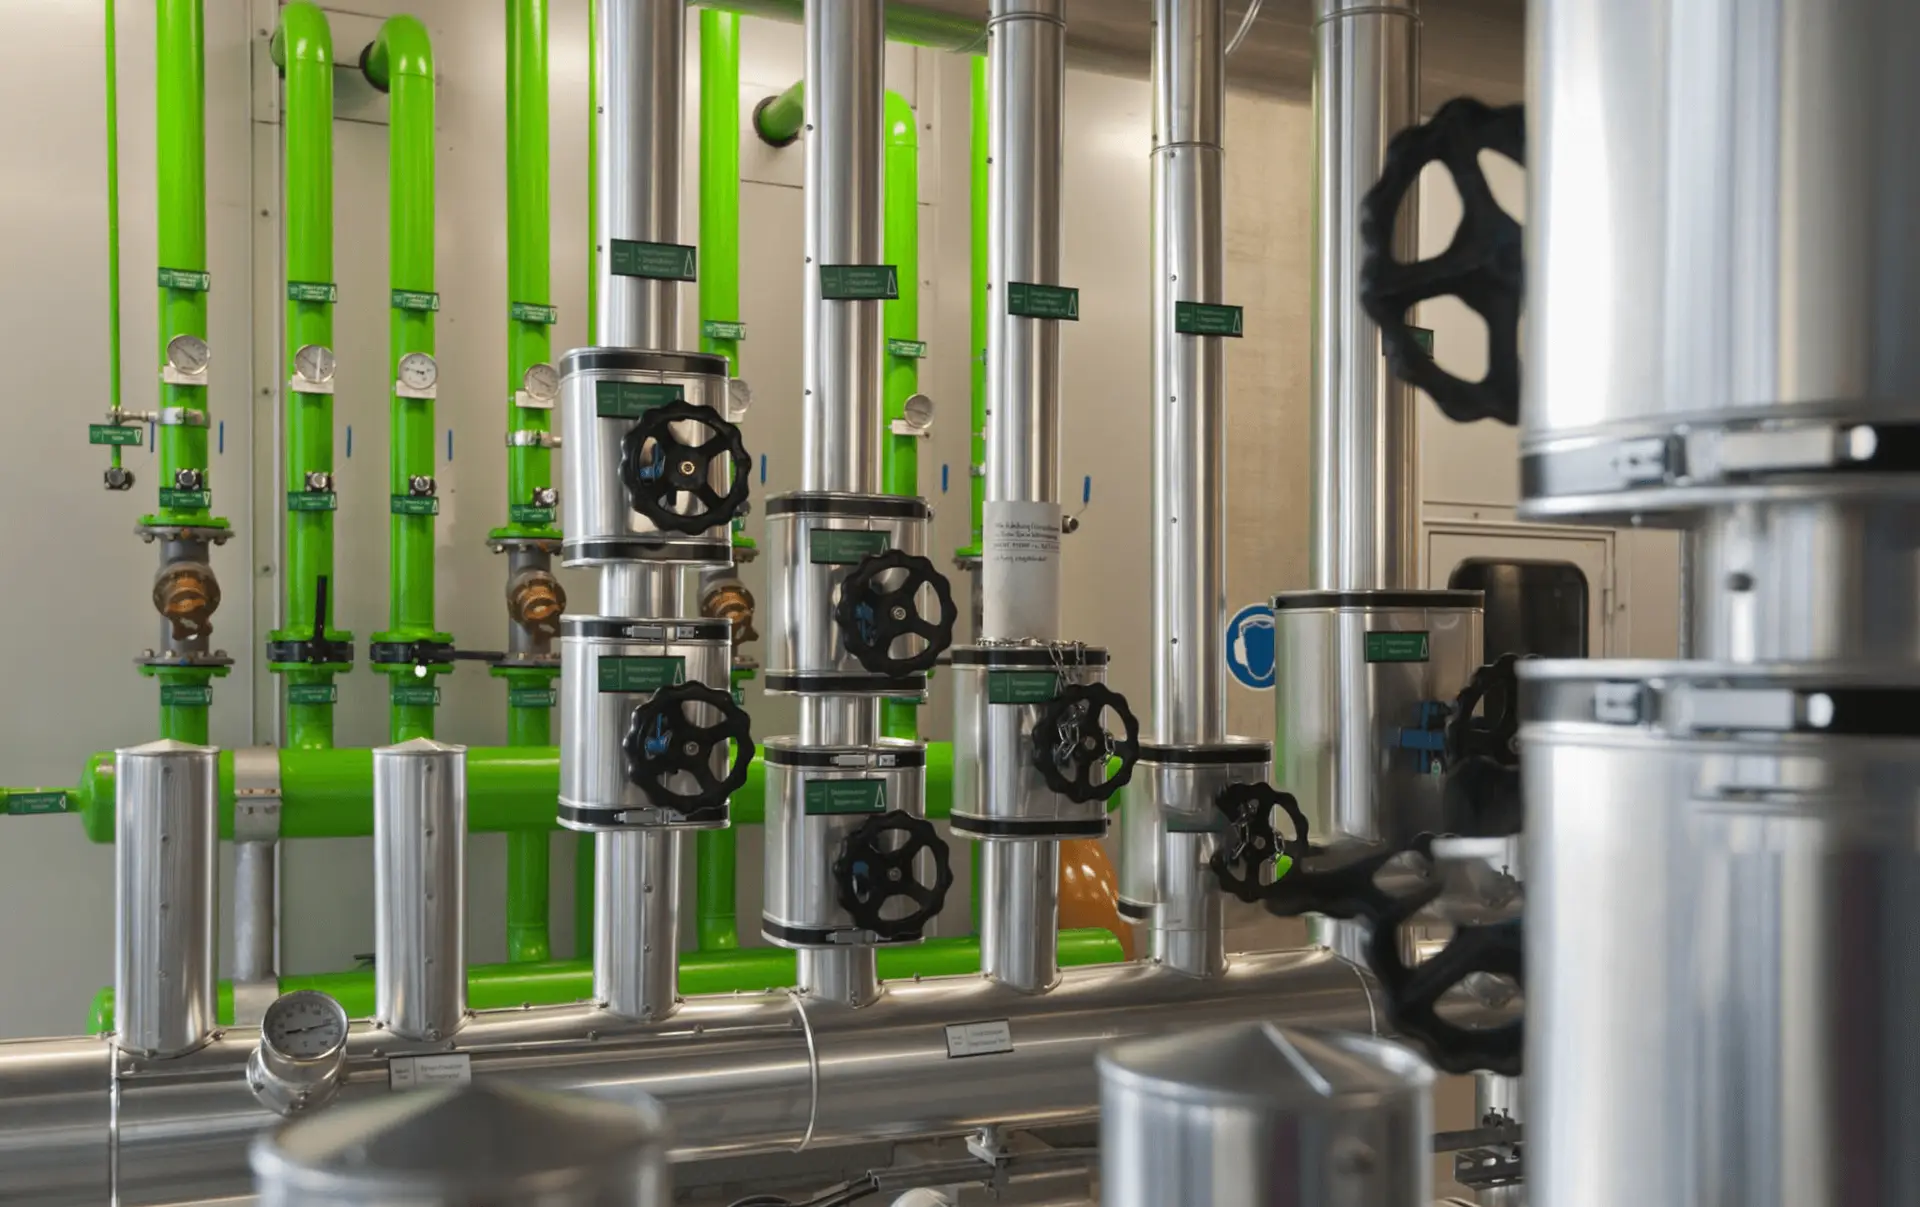
We’ve created a financial breakdown for 10 Hydrocarbon Recovery Unit (HRU) system to illustrate likely economic benefits
The ICF study did a study back in 2017 which looked at cases in Germany, China and India, and found that using U.S. LNG or imported pipelined gas for electricity generation produces on average 50.5 percent lower GHG emissions than electricity from coal in all base case scenarios studied — this includes carbon emissions from the fuel combustion itself, as well as carbon dioxide, methane, nitrous oxide and other GHGs emitted during the construction and operation of all related fuel supply chain and power plant infrastructure. This provides a clear picture of life-cycle emissions for natural gas powered electricity and demonstrates the importance of natural gas for achieving global emissions reductions particularly in Europe and Asia, where many countries have not yet transitioned power generation away from coal. In China, coal still makes up 66 percent of power generation — in India, it’s 74 percent, and also in Germany it also remains stubbornly high — nearly 30 percent. Coal generation in the U.S. has fallen from roughly 50 percent in 2005 to 24 percent in 2019, while natural gas generation has increased from 19 percent to nearly 40 percent in the same period. Transitioning to natural gas is a viable, affordable and realistic path for countries to continue meeting growing energy needs while slashing emissions and reducing the risks of climate change.
Source: API.org
The National Energy Technology Laboratory (NETL) analyzed and compared the greenhouse gas (GHG) emissions of exported U.S. LNG over its full life cycle with the life cycle emissions of regional coal or gas used for electricity in European and Asian markets. NETL’s life cycle analysis concluded that GHG emissions from U.S. LNG exports for power production in European and Asian markets compare favorably to the use of regional coal.